Dashboard
The Dashboard is where you can monitor your screens and content at a glance.
The Dashboard gives you an overview of your entire PiSignage deployment. The status of your screens, their performance, your locations and your playlists are all brought together in one place so you can quickly spot anything that needs your attention.
To view the dashboard simply click on Dashboard under Overview in the main menu.
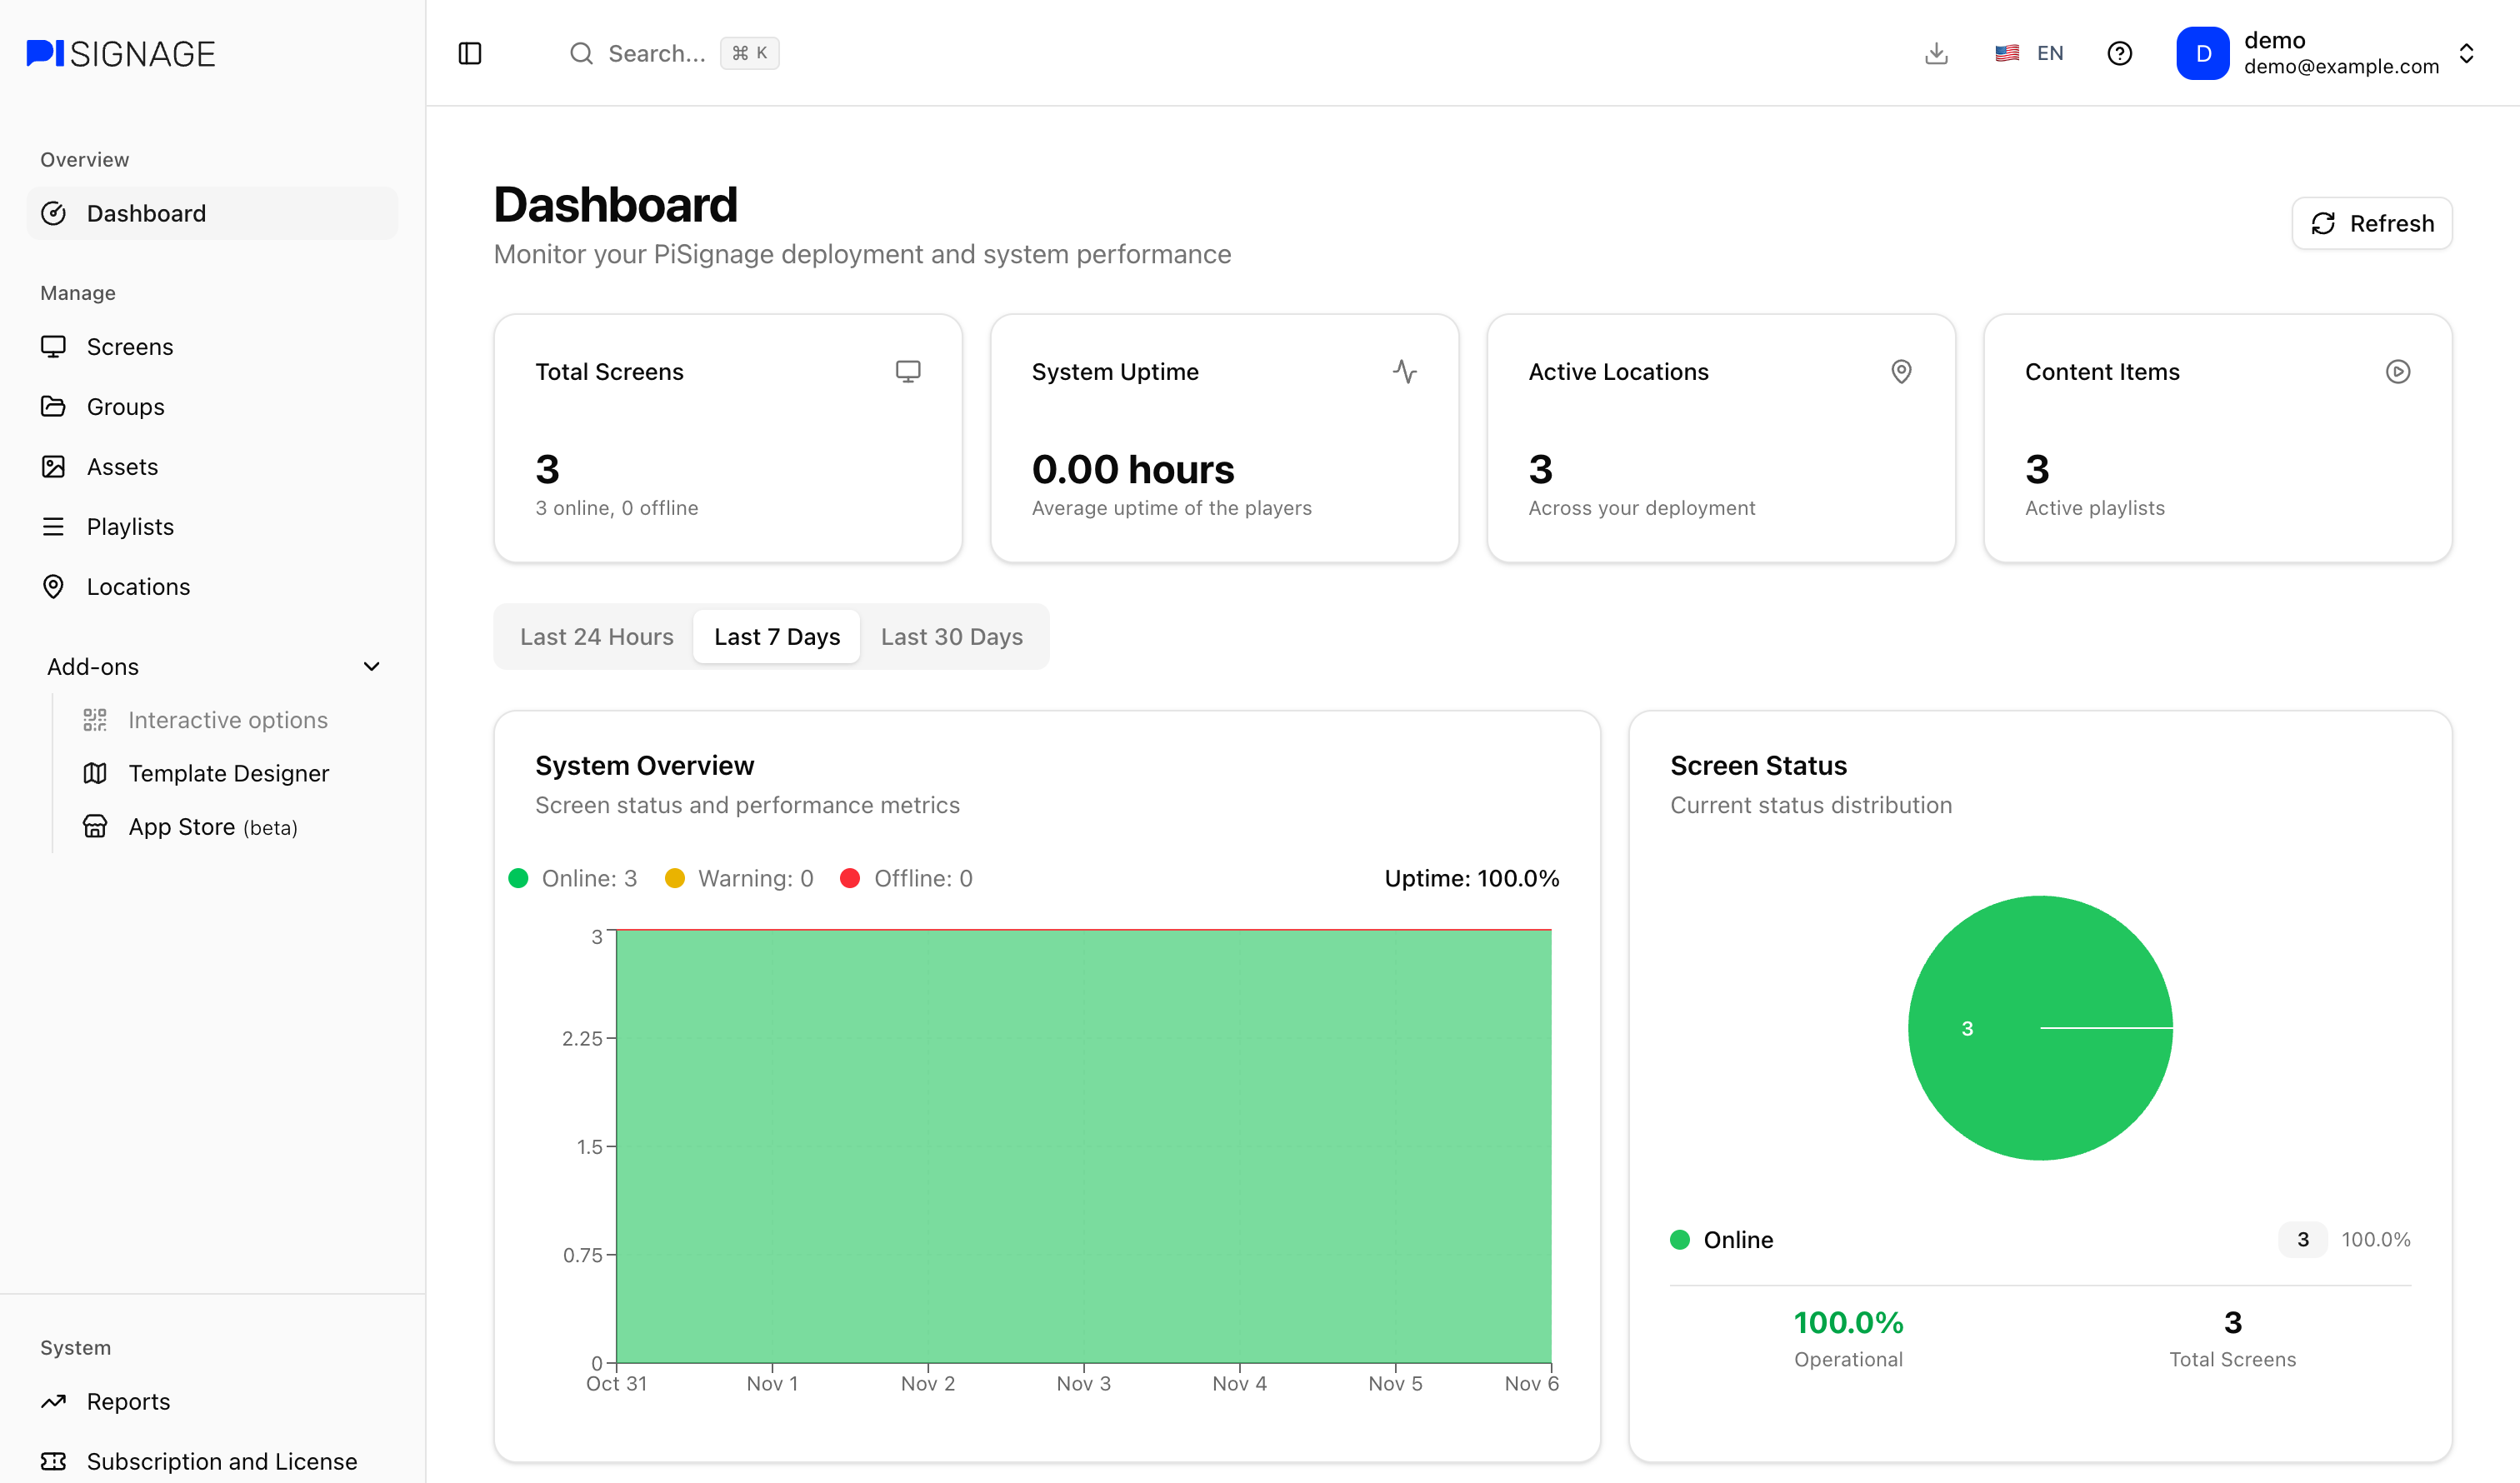
Summary
The cards at the top of the page give you a quick summary of your account.
- Total Screens: The number of screens in your account along with how many are online and offline
- System Uptime: The average uptime of your players in hours
- Active Locations: Locations across your deployment
- Content Items: Active playlists on your screens
Screen status
System Overview
System Overview shows how many of your screens are Online, in Warning or Offline along with the percentage of screens that are online (Uptime).
Warning covers screens that are online but need your attention. For example when no playlist is playing, the disk space is almost full or the TV is off. Screens covers what each player status means.
Screen Status
The Screen Status chart shows how your screens are split between Online, Warning and Offline with the number and percentage of screens in each. Below the chart, Operational is the percentage of your screens that are online and Total Screens is the number of screens in your account.
Last Reported Status
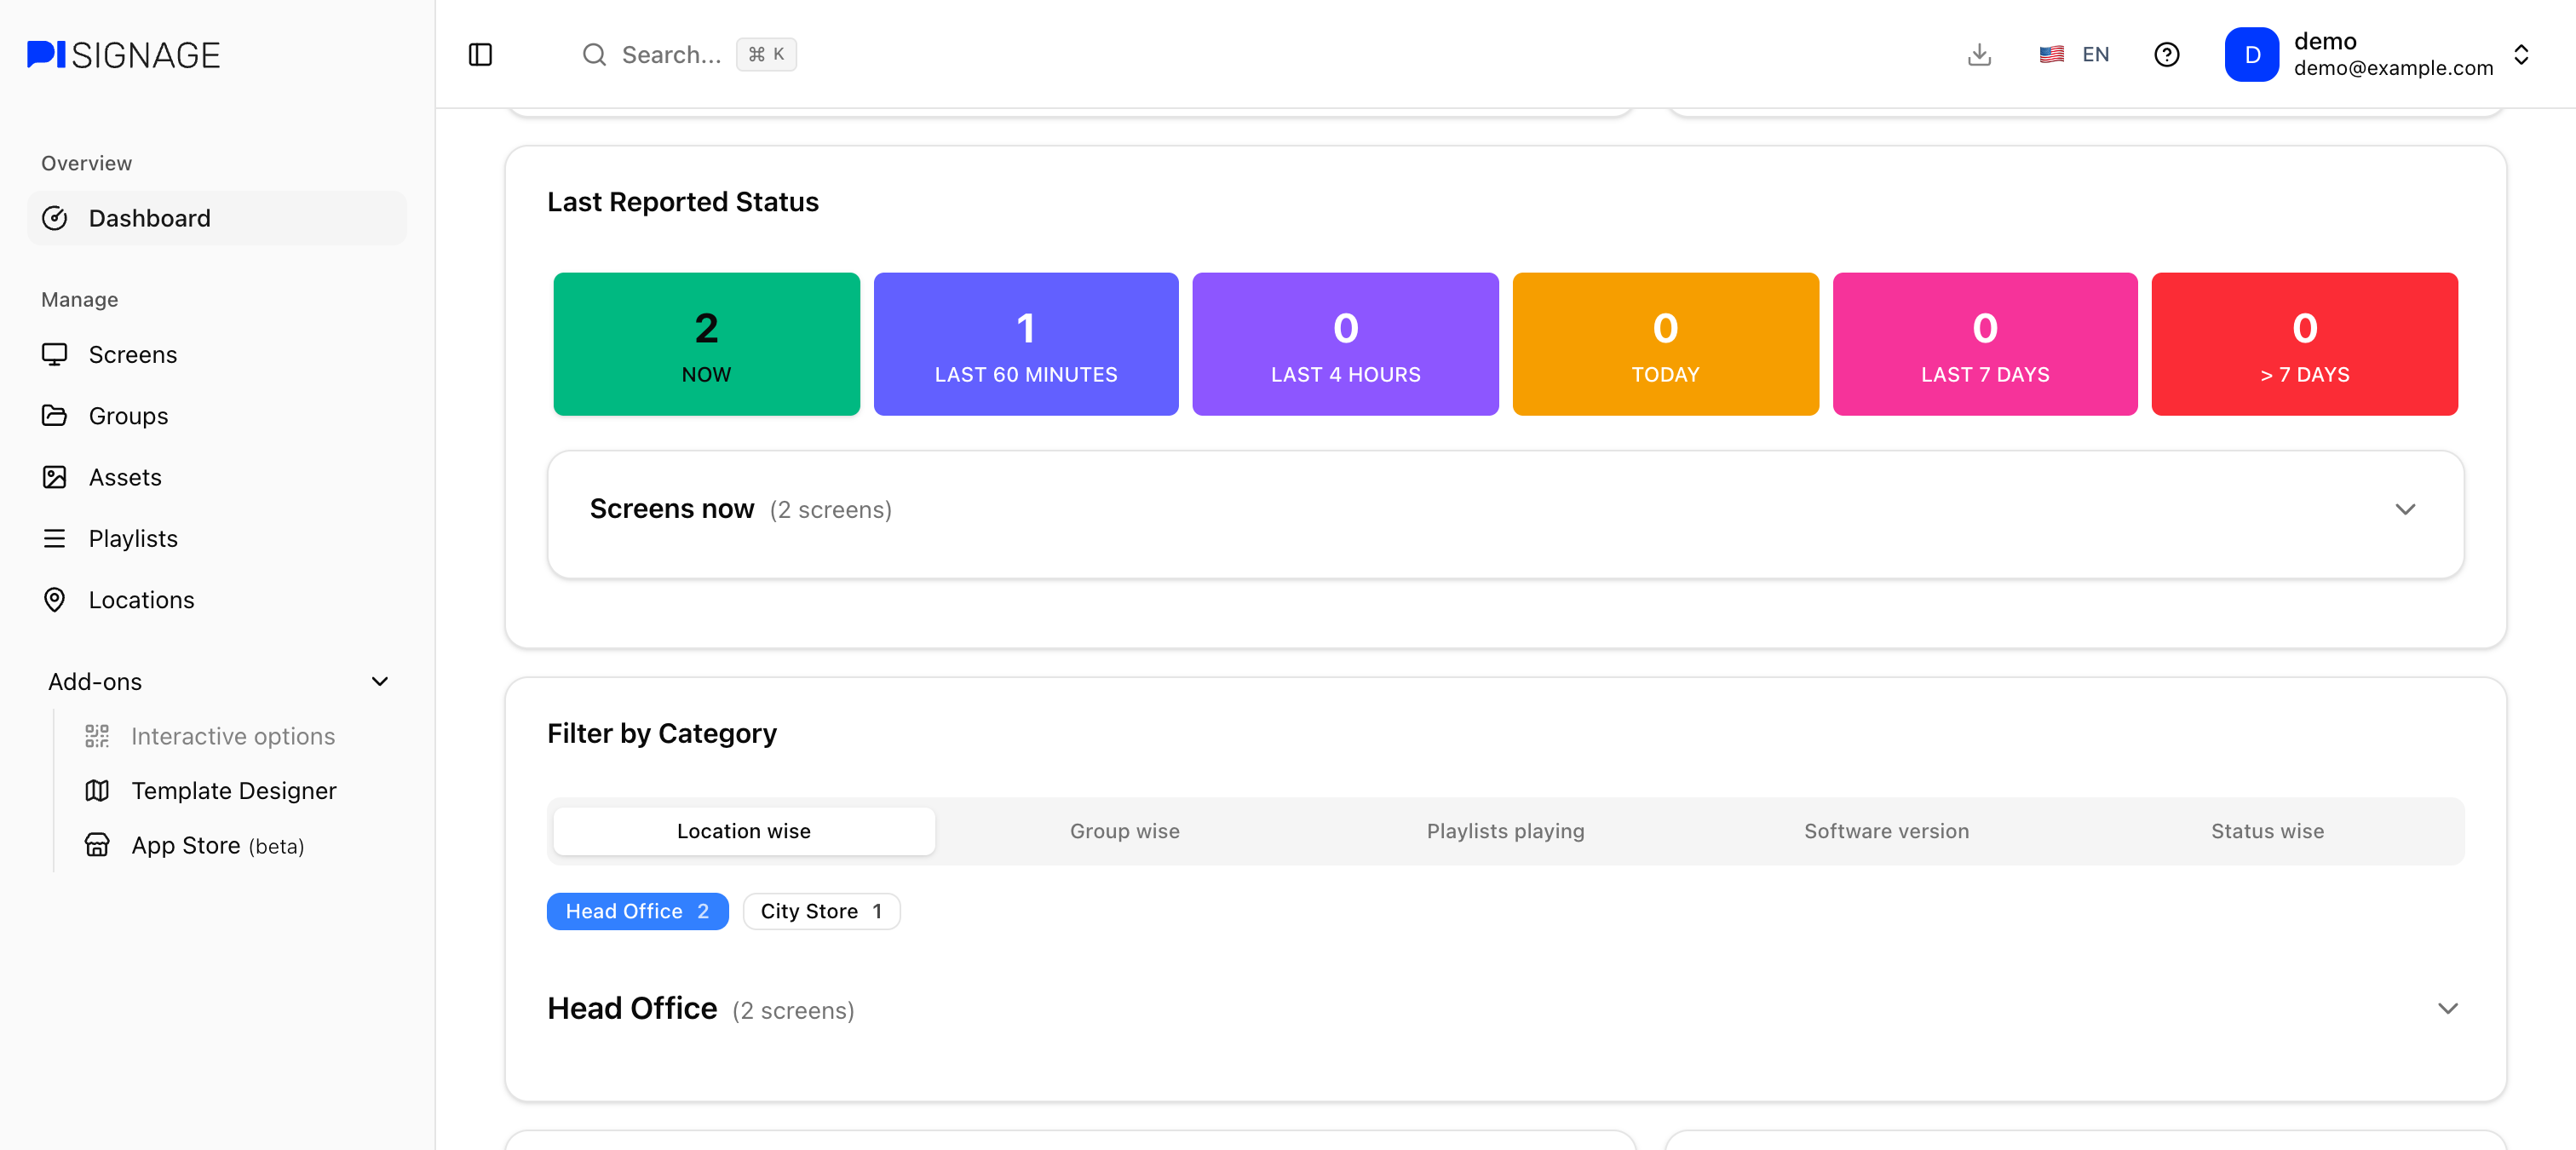
Last Reported Status groups your screens by when they last reported to the server. The tiles go from NOW, LAST 60 MINUTES, LAST 4 HOURS, TODAY and LAST 7 DAYS all the way to > 7 DAYS with the number of screens in each.
Click on a tile to view the screens in that time period. The list is collapsed by default, simply click on its header to expand the same. This is great for finding screens that have not reported in a while.
Filter by Category
Filter by Category breaks your screens down by one of the following
- Location wise: By the location of the screen
- Group wise: By the primary group of the screen
- Playlists playing: By the playlist currently playing on the screen
- Software version: By the player software version
- Status wise: By the player status
Each value is shown with the number of screens next to it and the value with the most screens is selected for you. Simply click on any value and then on its name below to view the list of screens.
These are not the same as Categories. They simply group your screens by the details above.
Performance Metrics
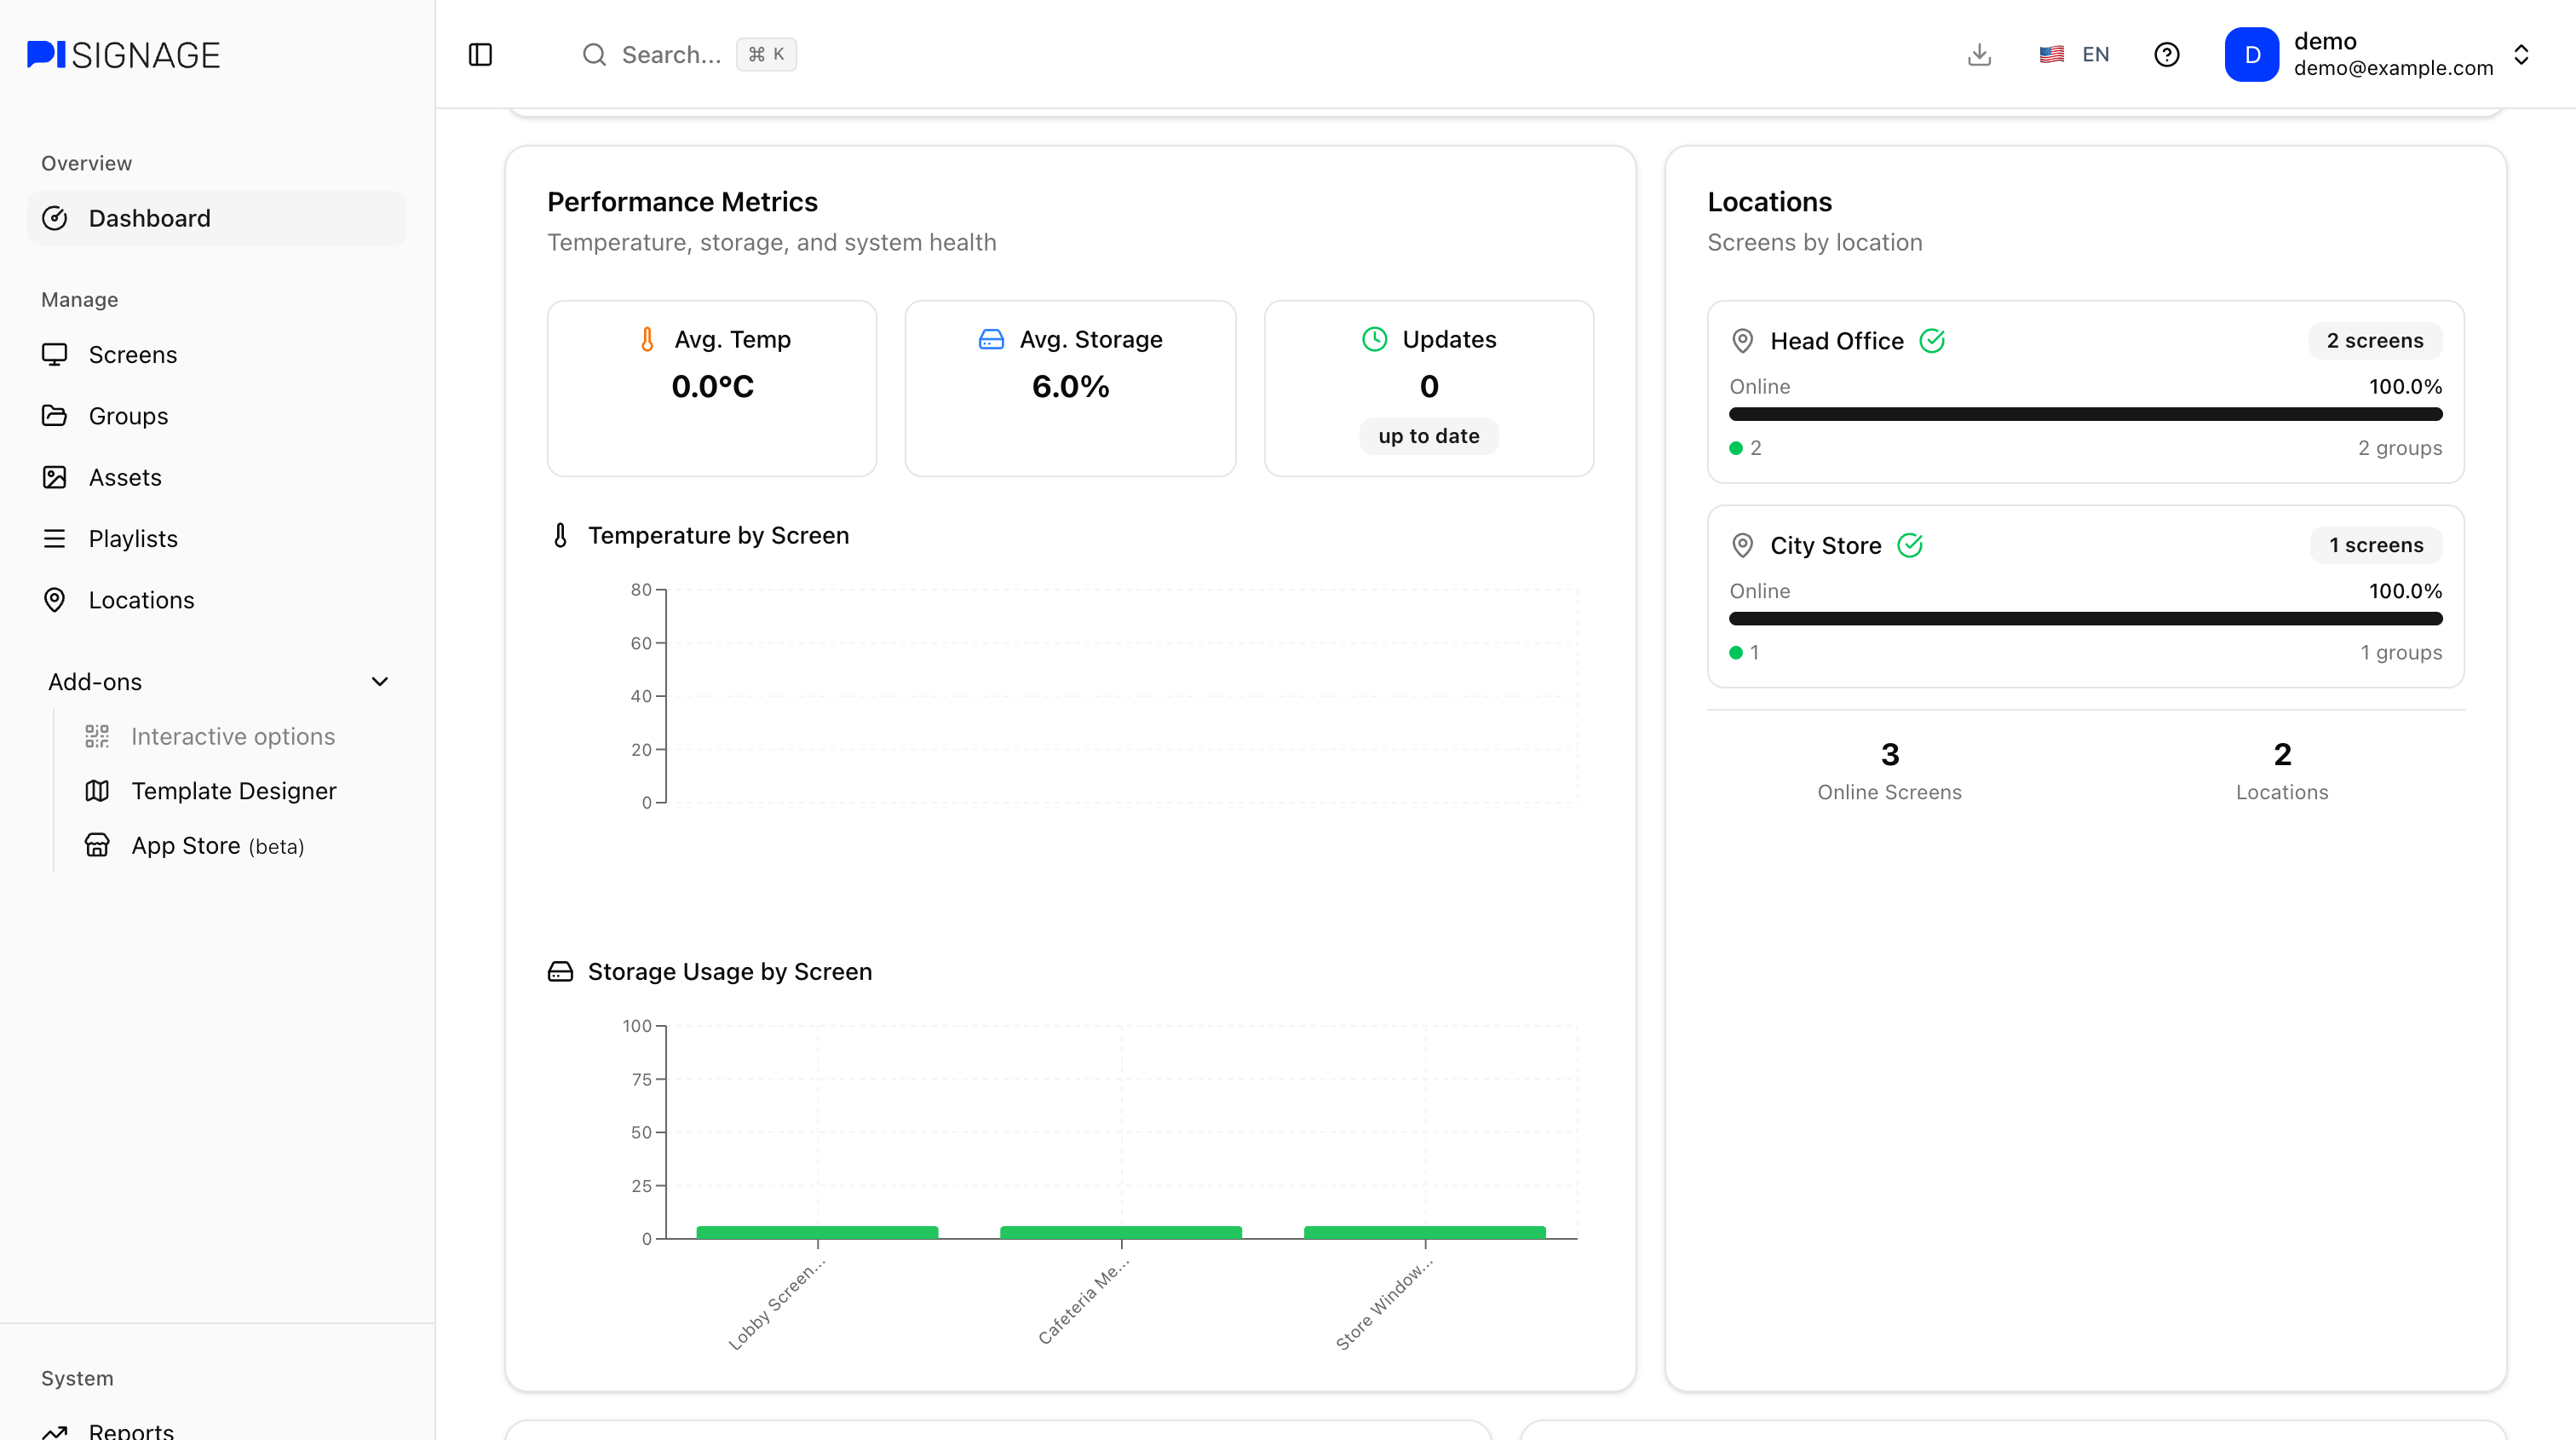
Performance Metrics covers the temperature, storage and system health of your players.
- Avg. Temp: The average temperature of your players. Players running above 80°C are counted as high
- Avg. Storage: The average storage used across your players. Players using more than 90% are counted as full
- Updates: The number of players with a new player version available. See Screens to update your players
The Temperature by Screen and Storage Usage by Screen charts show the 8 screens running the hottest and using the most storage. The bars turn yellow and then red as they get closer to the limit.
When a screen runs above 80°C or uses more than 90% of its storage, a Performance Alerts box appears below the charts.
Temperature is only available on RPI models.
Locations
The Locations card lists each of your locations with the number of screens, the percentage of screens online, a count of screens that are online, in warning and offline and the number of groups in the location. The totals at the bottom show the number of screens online and the number of locations.
You can add and manage your locations in Locations.
Content Distribution
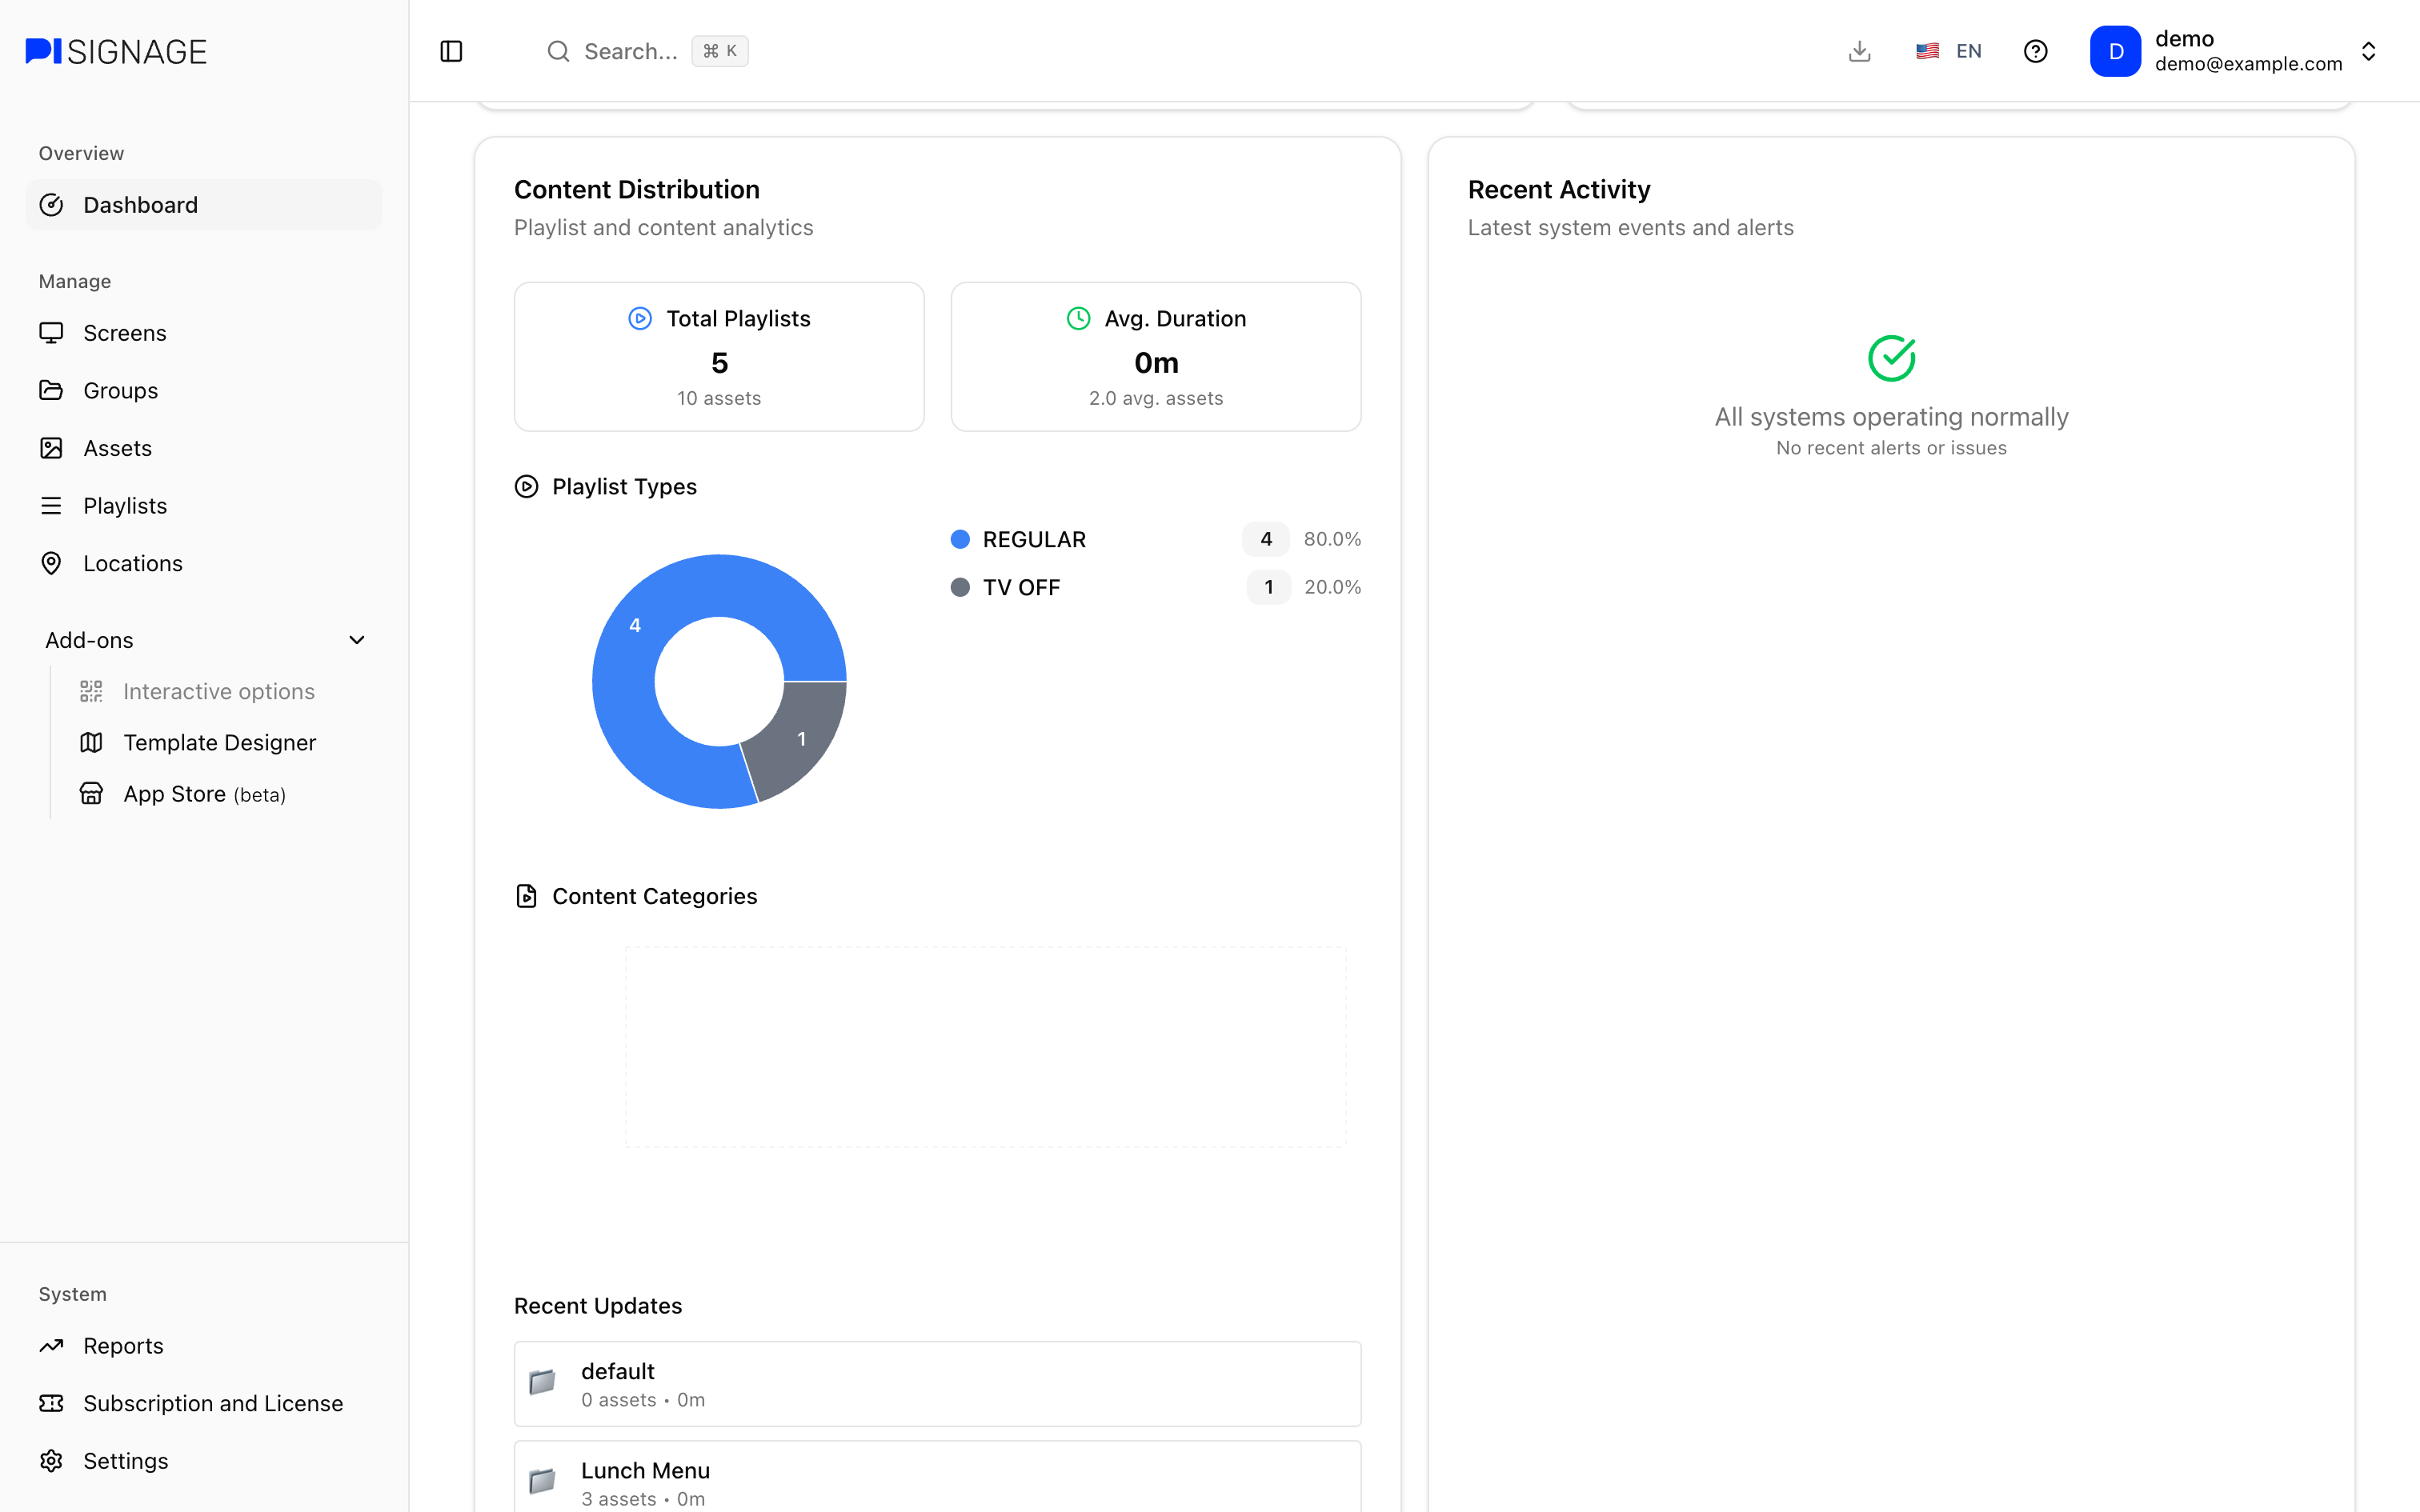
Content Distribution gives you analytics on your playlists.
- Total Playlists: The number of playlists in your account along with the number of assets in them
- Avg. Duration: The average duration of your playlists along with the average number of assets in each
- Playlist Types: The number of playlists of each type. You can read more about the types of playlists in Playlists
- Content Categories: The Categories used the most across your playlists
- Recent Updates: The 5 most recently updated playlists with the number of assets and the duration of each
Recent Activity
Recent Activity lists the latest alerts for your screens such as a screen going offline or a new player version being available. When there is nothing to report you will see “All systems operating normally”.
System Alerts
When one or more screens have a new player version available, a System Alerts box appears at the bottom of the dashboard with the number of screens that can be updated and, if any, the number of screens that need a license. You can update and license your players from Screens.